Quick Links
- Normal Point Data
- Formats
- Software
- Cite the ILRS
- Revised ILRS station screening process at ILRS Operations Centers (NASA and EDC)
Product Description
This description is also available in PDF form.
Official ILRS analysis products
V. Luceri (e-GEOS S.p.A., ASI/CGS, cinzia.luceri@e-geos.it)
E. Pavlis (JCET/UMBC & NASA Goddard, epavlis@umbc.edu)
C. Sciarretta (Telespazio S.p.A., cecilia.sciarretta@telespazio.com)
R. Kelm (DGFI, retired)
Contents:
- Introduction
- ACs, CCs and weekly analysis flow.
- Individual solutions
- Combined official primary product ILRSA
- Combined official backup product ILRSB
- ILRSA and ILRS comparison
- ILRS products at CDDIS and EDC
- ILRS solution for ITRF2005
- Appendix 1
Introduction
The ILRS products consist of SINEX files of weekly station coordinates and daily Earth Orientation Parameters (x-pole, y-pole and excess Length-Of-Day (LOD)) estimated from 7-day arcs (Sunday 00 UTC to Saturday 24 UTC). Two types of products are distributed each week: a loosely constrained estimation of coordinates and EOP and an EOP solution, derived from the previous one and constrained to an ITRF, currently ITRF2000. Official ILRS Analysis Centers (AC) and Combination Centers (CC) are tasked with the generation of the products with individual and combined solutions respectively. Both the individual and combined solutions follow strict standards agreed upon within the ILRS Analysis Working Group to provide high quality products consistent with the IERS Conventions 2003. The standards of the ILRS products are subject to change to improve the quality and other types of products will be considered. This description refers to the status as of January 2007.
ACs, CCs and weekly analysis flow
Each weekly solution is obtained through the combination of weekly solutions submitted by the official ILRS Analysis Centers:
- ASI, Agenzia Spaziale Italiana
- BKG, Bundesamt fuer Kartographie und Geodaesie
- DGFI, Deutsches Geodaetisches Forschungsinstitut
- GFZ, GeoForschungsZentrum Potsdam
- JCET, Joint Center for Earth Systems Technology
- NSGF, NERC Space Geodesy Facility
These ACs have been certified after passing the benchmark tests that were developed by the Analysis Working Group (AWG). Other analysis centers are now under test and on the way to qualify as official ILRS Analysis Centers after being certified to pass the same benchmark tests. The combination is made by the official primary Combination Center (ASI) and the official backup Combination Center (DGFI). The selection of the two CCs was done in 2004, after a pilot phase in which the solutions from the candidate centers were evaluated. Both the ACs and CCs must follow strict timelines and provide routinely products of the highest possible quality. Since January 2004 the ILRS official ACs provide every Tuesday individual SSC/EOP loosely constrained solutions, combined and published every Wednesday by the CCs. The individual solutions are based on the analysis of weekly batches of SLR data covering from Sunday to Saturday included. The combined products, loosely constrained SSC/EOP and ITRF-constrained EOP, are thus provided with a latency of less than 4 days with respect to the last SLR observations considered. In addition to the routine forward extension of the time series through the weekly analysis, backward solutions have already been provided back to 1993 and at present, they are updated to the current ILRS standards. A current effort is in progress that will result in an extension of the time series as far back as the mid 70s.
Individual solutions
SLR observations on LAGEOS-1, LAGEOS-2, Etalon-1 and Etalon-2 are reduced in 7-day arcs to generate the individual EOP and station positions solutions; the measurements are retrieved from the official ILRS archives either at CDDIS and/or EDC archiving facilities. The observations are reduced to generate a loosely constrained solution for station coordinates and EOPs. The EOPs include xp,yp and LOD, all computed as a daily average and reported at 12:00 UTC; daily UT1-UTC differences are also allowed to adjust freely, but they are of course not considered as SLR-determined parameters as they are not estimable by any satellite technique and are not included in the analysis product that is submitted to the combination centers. The station positions, referenced to the midpoint of each 7-day arc, refer to the official station markers. Analysis contributors are free to follow their own computation model and/or analysis strategy, but a number of constraints must be followed for consistency:
- The computation models follow the IERS 2003 Conventions as closely as possible.
- The stations are included (positions estimated) in the weekly analysis if the number of observed LAGEOS-1 plus LAGEOS-2 ranges is greater than 10. Data weighting is applied according to the analyst's preference. However, the AWG has agreed to down-weight "non-core" sites significantly.
- The tropospheric correction, starting January 2007, is applied using the Mendes-Pavlis model (solutions submitted before January 2007 used the Marini-Murray formula and are currently re-analysed using the new standard), no modeling of atmospheric pressure loading is considered and no estimation of tropospheric zenith delay biases.
- The standard center-of-mass correction for the LAGEOS satellites is 251 mm, however, for the station 7840 it is 245 mm (based on the ILRS standards and the modus operandi of that system)
- Range biases are nominally not modeled or estimated except for those listed in Appendix 1
- The solutions are loosely constrained with an a priori standard deviation on station coordinates of 1 meter and the equivalent of at least 1 m for EOPs.
Further details on the individual AC analysis strategy can be found in the COMMENT section of the SINEX files.
ILRS official combined product (primary CC ILRSA)
Introduction: The combined solution is produced by the primary Combination Center, ASI/CGS, designated ILRSA. The main lines of the combination methodology rely on the direct combination of loosely constrained AC solutions; this straightforward method [P. Davies and G. Blewitt, 2000] allows handling input solutions easily, with no inversion problems for the solution variance-covariance matrix and no need to know a priori values for the estimates. The reference frame is defined stochastically and is unknown; no relative rotation between the reference frames is estimated and removed. The ASI-CGS SW chain, based on these loose combination algorithms, has been implemented in a completely general case, to handle site coordinates, EOP, EOP rates [Bianco et al., 2003] and it is completely automated.
Parameter and scale factor estimation: The combination is performed along the lines of the iterative Weighted Least Square technique, wherein each contributing solution (and related variance-covariance matrix) plays the role of an 'observation' whose residuals with respect to the combined solution must be minimized; each solution is stacked using its full covariance matrix rescaled by a factor. A scaling of the covariance matrix of the i-th solution is required because the relative weight of the contributing solutions may be incorrectly balanced due to differing weighting schemes between ACs. Imposing χ2=1 for the combination residuals and requiring that each contribution to the total χ2 is equally balanced, the relative scaling factors (σi) is estimated iteratively together with the combined solution. Denoting with Ri the solution residuals (with respect to the combined product) and Σi the solution covariance matrix, the imposed conditions are:
R1T(σ1Σ1)-1R1 = ⋯ = RiT(σiΣi)-1Ri and R1TΣ1-1R1 + ⋯ + RiTΣi-1Ri = 1
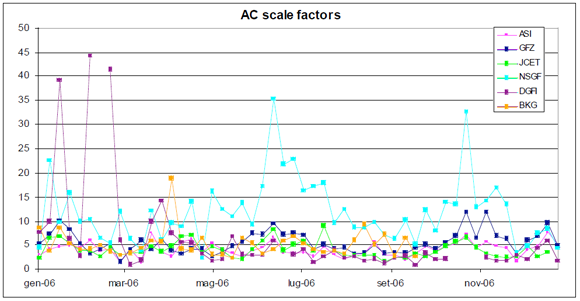
The first guess for the combination is obtained with σi = 1 for each solution. Table 1 shows the mean value and the standard deviation of the scale factors for each contributing agency for the period 1993-2006. Fig. 1 displays the values for 2006 (BKG started contributing in 2006 and is not listed in Table 1).
Table 1 - Mean scaling factors in 1993-2006 solutions
| ASI | DGFI | GFZ | JCET | NSGF | |
|---|---|---|---|---|---|
| Mean | 4.7 | 18.0 | 10.8 | 7.9 | 9.2 |
| Std deviation | 3.5 | 72.4 | 33.4 | 7.8 | 4.0 |
Outlier analysis: A rigorous editing has been introduced in the process of the ILRSA combination: any estimated parameter in the incoming solutions being not site coordinates nor EOP (e.g. range bias, ...) has been rigorously pre-eliminated [ E. Brockmann, 1996].
The same technique has been used to eliminate:
- weak site estimations (<10 NP) erroneously present in the contributing solutions
- weak site estimations in the contributing solutions, with uncertainties greater than 0. 8m, in at least one component, after transformation to ITRF2000
- poor estimates in the contributing solutions, with discrepancy greater than 0.3 m w.r.t. ITRF2000 in at least one coordinate for the set of Core Sites, 0.5 m for the other sites (Arequipa excluded)
- outliers with respect to the combined solution following a 5σ criterion.

Fig. 1: Scale factors for the AC contributions to the ILRSA combinations for the year 2006.
The list of core sites has been officially defined, within the Analysis Working Group, considering the quality and stability of these network sites.
Summary file: The results are complemented by a summary file assessing the quality of solutions by means of comparisons with respect to the SSC and EOP reference values (ITRF2000; USNO 'finals.daily'; of the week). The summary file also contains comparison with the combined solution in terms of: coordinate residuals, EOP residuals and transformation parameters of the individual contributions with respect to ITRF2000 and the combined solution.
Summary: The ILRSA products are automatically generated and human intervention is only limited to failures due to errors in the input solutions which are by now very rare. The routine process is stable and reliable and results in a robust and valuable monitoring of site coordinates and EOPs.
The mean values of the 3-dimensional wrms of the site coordinate residuals with respect to the combined solution obtained considering all the stations of the network for the entire time span 1993-2006 and the year 2006, are shown in Table 2.
Table 2 - 3D wrms (mm) of site coordinates with respect to ILRSA
| Time span | ASI | BKG | DGFI | GFZ | JCET | NSGF |
|---|---|---|---|---|---|---|
| 1993-2006 | 9.4 | N/A | 20.7 | 11.4 | 9.7 | 16.9 |
| 2006 | 5.5 | 7.3 | 11.7 | 7.2 | 6.3 | 12.2 |
An assessment of the ILRSA product quality has been presented at the 15th International Workshop on Laser Ranging in October 2006 [Bianco et al., 2006].
ILRS official backup combined product (backup CC ILRSB)
Introduction: The Deutsches Geodätisches Forschungsinstitut (DGFI) hosts the ILRS official backup combination center (ILRSB). The principle of the combination method is the application of the rigorous Variance Component Estimation (VCE) as described in [K.R. Koch, 1999]. The use of VCE results in the combination to the estimated parameters (in the case of ILRS station coordinates, polar motions, and LOD) in estimates of the variance scaling factors for each of the contributed solutions. Further more, VCE serves also as our preferred process for outlier determination and elimination, [R. Kelm, 2007]. The ILRSB combination software is part of a general software package for intra- and inter-technique combination.
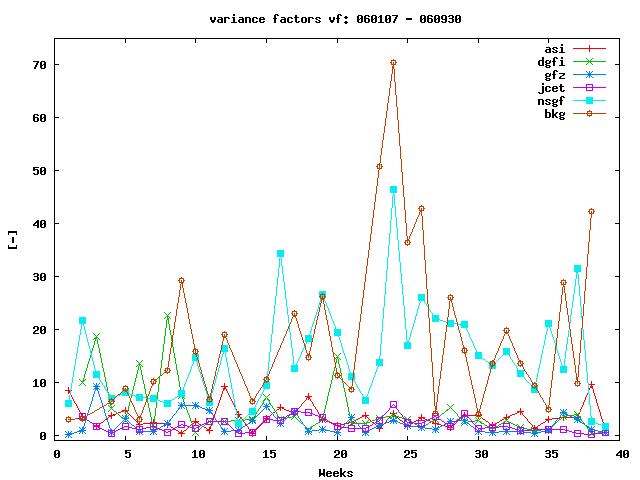
Parameter and variance factor estimation: The loose constraints imposed by the ACs for the generation of the weekly solutions are subtracted from the inverted covariances and these are thus reduced to the original normal equations level. Our processing follows the computation of minimal constraints solutions for each input set. The minimal constraints are defined by three rotations of the similarity transformation parameters over the core stations. The minimal constraints solutions serve as input to VCE, which upon iteration delivers estimated parameters and variance factor values, both with standard deviations, the scaled minimally constrained input covariance matrices as well as the covariance matrix of the estimated parameters. An example for variance factors is presented in Fig. 2.

Fig. 2: Variance factors for the year 2006.
Outlier analysis: In some cases the variance factors obtain unrealistic values (too small or even negative values). It can be proven that such unrealistic variance factors are a sign of deficiencies in at least one of the input solutions, and - even more important - these deficiencies can be corrected by applying numerical search methods in an unambiguous way. Thence, VCE is a tool for identifying and eliminating outliers in an automated unbiased processing mode. An example is given in Table 3.
A negative variance factor for ASI's contribution appears in Table 3a. This indicates that at least in one of the input solutions one or more parameters are weakly determined. Table 3b reveals that the minimally constrained covariance matrix diagonals for station 1868 are too large relative to those of other stations (here station 1864 of the DGFI solution), - an indication that this station is weakly resolved in the DGFI solution. After elimination of this station the variance factors take reasonable values as it is seen in Table 3c.
| Table 3a. Case of negative variance factors: variance factors vf and their variances var(vf) for week 040605 (June 5, 2006) | Table 3b. Case of negative variance factors: too large variances (station 1868) w.r.t. the others (here station 1864) in dgfi solution | Table 3c. Case of negative variance factors: variance factors vf and their variances var(vf) after elimination of station 1868 | ||||||
| AC | vf | var(vf) | Type | Stations | AC | vf | var(vf) | |
| asi | -5.47243 | -0.08143 | 1864 | 1868 | asi | 2.13392 | 0.06577 | |
| dgfi | 1.39871 | 0.02983 | X | 0.095 | 214.245 | dgfi | 1.56153 | 0.70496 |
| gfz | 17.27833 | 0.46013 | Y | 0.189 | 1621.086 | gfz | 1.2875 | 0.03986 |
| jcet | 10.32468 | 0.19957 | Z | 0.148 | 515.873 | jcet | 13.14136 | 0.35086 |
| nsgf | 14.39704 | 0.3059 | nsgf | 14.66828 | 0.46992 | |||
Summary file: The results of the estimation and quality analysis are presented in a summary file. Two examples are given here for the quality analysis. In Table 4 the first five smallest eigenvalues of the unconstrained normal equation matrix of the input solutions are given for the week of 06/12/30. In theory, the first three smallest eigenvalues should take zero values. A significant jump is seen between the third and fourth eigenvalue in Table 4 indicating a rank deficiency of three as it is theoretically expected.
Table 4: First smallest eigenvalues of the unconstrained normal equations
| AC | eig val 1 |
eig val 2 |
eig val 3 |
eig val 4 |
eig val 5 |
asi |
5.91E-10 |
9.08E-10 |
1.01E-07 |
2.42E-05 |
3.79E-05 |
bkg |
5.08E-18 |
2.26E-17 |
1.34E-10 |
2.82E-06 |
3.37E-06 |
dgfi |
-5.16E-06 |
-4.89E-09 |
-2.41E-09 |
7.62E-06 |
1.63E-05 |
gfz |
1.72E-10 |
7.66E-09 |
1.07E-08 |
1.61E-05 |
2.00E-05 |
jcet |
5.63E-10 |
9.38E-10 |
3.75E-08 |
1.13E-05 |
1.51E-05 |
The next example is the rank type analysis ET Nunc E = 0 with E being the similarity transformation parameter coefficient matrix for the translations tx, ty and tz, for the rotations rx, ry, and rz, and for the scale sc, and Nunc is the unconstrained normal equation matrix.
Table 5: Rank type analysis ET Nunc E = 0.
| AC | tx |
ty |
tz |
rx |
ry |
rz |
sc |
asi |
2.31E+06 |
3.76E+06 |
4.22E+05 |
8.57 |
12.4 |
1.27 |
5.76E+06 |
bkg |
2.04E+06 |
3.60E+06 |
4.18E+05 |
9.43E-08 |
2.46E-08 |
0.00255 |
5.06E+06 |
dgfi |
1.08E+06 |
1.20E+06 |
1.21E+05 |
-12.4 |
-7.87 |
-28.8 |
1.60E+06 |
gfz |
2.79E+06 |
3.81E+06 |
3.99E+05 |
88.9 |
99.6 |
0.00255 |
4.70E+06 |
jcet |
3.54E+06 |
5.23E+06 |
6.70E+05 |
12.7 |
19.3 |
0.716 |
8.25E+06 |
In theory, the values for the rotations rx, ry, and rz should be zero. In Table 5 the rotation values are sufficiently small relative to the translations and the scale parameter values tx, ty, tz, and sc, demonstrating thus the rotational rank deficiency of Nunc.
Summary: ILRSB has been routinely producing weekly combination solutions since the start of official ILRS products in June 2004. ILRSB also contributed in the backward processing of weekly combination solutions between 1993 and 2004. About 730 weekly solutions have been computed for the period covering the past 14 years up to now. About 96% of them were processed in time and presented an accuracy level as expected for SLR data. In the other cases the combination failed to be delivered on time because of delayed arrival of sufficient clean input solutions or of hardware problems at DGFI.
In the future, it is planned to improve the automated processing in the estimation and analysis processing. Especially in the case of the graphic representation of time series for the estimated parameters (coordinates, EOP, similarity) and the variance factors, including their standard deviations.
Comparison of the ILRSA and ILRSB combinations
The official ILRSA solution is routinely compared with the backup combined solution ILRSB that is produced by DGFI (the official ILRS backup combination center) following a fundamentally different approach. The results show a good agreement between the two solutions and absence of any systematic differences. The two tables below briefly show this agreement in terms of:
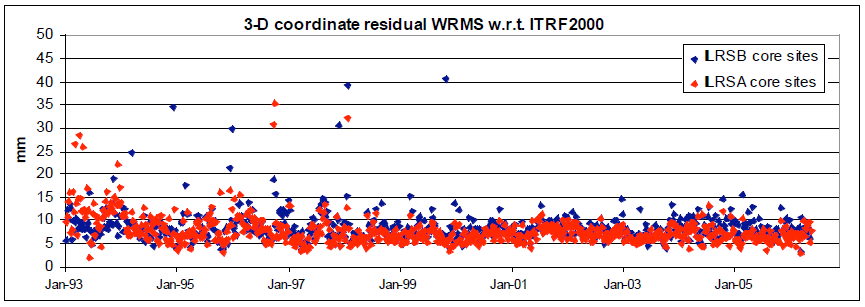
- mean 3D wrms of the site coordinates residuals with respect to ITRF2000 (Table 6 and Fig. 3);
- mean differences of the translation and scale parameters with respect to ITRF2000 computed using the two time series ILRSA and ILRSB (Table 7);
- EOP residuals with respect to EOPC04 (Table 8) for the year 2006.
Table 6 - 3D wrms of the site coordinates residuals w.r.t. ITRF2000
|
ILRSA(mm) |
ILRSB(mm) |
All sites (mean) |
21.5 |
26.0 |
Core sites (mean) |
8.0 |
10.1 |

Fig. 3 - 3D wrms of the core site coordinates residuals with respect to ITRF2000
Table 7 - Translation and scale (with respect to ITRF2000) differences between ILRSA and ILRSB
|
TX(mm) |
TY(mm) |
TZ(mm) |
SCALE(mm) |
Weighted Mean |
1.14±0.18 |
-0.24±0.18 |
-0.10±0.41 |
0.05±0.26 |
WRMS |
3.14 |
2.27 |
4.03 |
3.13 |
Table 8 - EOP daily residuals with respect to EOPC04 for ILRSA and ILRSB
|
ILRSA |
ILRSB |
||
|
WMEAN |
WRMS |
WMEAN |
WRMS |
EOP-X (mas) |
-0.055 |
0.153 |
0.020 |
0.175 |
EOP-Y (mas) |
0.193 |
0.153 |
0.244 |
0.197 |
LOD (ms) |
0.003 |
0.047 |
-0.003 |
0.054 |
The individual as well as the combinations of the ILRS ACs and CCs are monitored on a weekly basis with a graphical and a statistical presentation of these time series through a dedicated web site hosted by the JCET AC at:
http://geodesy.jcet.umbc.edu/ILRS_AWG_MONITORING/
Archival of the official ILRS products at CDDIS and EDC
The ILRS products are available, via https from the official ILRS Data Centers CDDIS/NASA Goddard (https://cddis.nasa.gov/archive) and via ftp from EDC/DGFI (ftp://edc.dgfi.tum.de/).
They are stored in subdirectories 'slr/products/pos+eop/YYMMDD', where 'YYMMDD' is the date (YY=2 digit year, MM=2 digit month, and DD=2 digit day) of the end date of each 7-day interval. Within each subdirectory, there are solutions from each individual AC and combination solutions from each individual CC as explained hereafter.
The official primary ILRS combination (ILRSA) products are available from the ILRS ftp archive. The files are labelled ilrsa.pos+eop.YYMMDD.vN.snx and, in a similar fashion, the EOP solutions are labelled ilrsa.eop.YYMMDD.vN.snx
The ILRS official backup combination center (ILRSB) products are labelled ilrsb.pos+eop.YYMMDD.vN.snx and ilrsb.eop.YYMMDD.vN.snx
Individual ILRS Analysis Center contributions to the official combination pos+eop and eop product are found at the ILRS data centers within the directory: CENTER.pos+eop.YYMMDD.vN.snx
Here, 'CENTER' is replaced by the name of the actual contributor (asi, bkg, dgfi, gfz, jcet, nsgf), and N is the version number. If re-computations are necessary, the version number will be increased sequentially by one. The results are stored in the SINEX format ('.snx'). The reader is referred to the COMMENTS section of each solution (in the file itself) or more general explanations of SINEX for further details of the solution and/or the format or the ILRS web site documentation of the ACs.
For more information and/or suggestions, please contact the CDDIS/EDC Data Center representatives (Patrick Michael, benjamin.p.michael @ nasa.gov and Christian Schwatke, christian.schwatke @ tum.de, respectively) or the ILRS Analysis Coordinator : Erricos C. Pavlis, epavlis @ umbc.edu.
ILRS contribution to ITRF2005
The time series of weekly solutions from 1993 to 2005, produced by the primary combination center, was delivered to IERS/ITRS as an official ILRS contributed data set for ITRF2005. Several months of joint work within the ILRS AWG have been devoted to the quality assessment of the contributing solutions from the ILRS ACs as well as the final combined solutions from the ILRS CCs. The final version of the combined ILRS time series was submitted in December 2005.
These time series are substantially equivalent to the ones that are generated after January 2007 and those to be soon available for the past period of 1993 - 2006 and only differs from that in the applied tropospheric model (Marini-Murray for the old vs. Mendes-Pavlis for the new series) and the modelling of a range bias due to Stanford event timers' non-linearities for a subset of stations. The description of the official contribution to ITRF2005 is available at:
http://itrf.ensg.ign.fr/ITRF_solutions/2005/doc/ILRS_ITRF2005_description.pdf .
The SINEX files are available at CDDIS and EDC as version 50, each file named following the format:
ilrsa.yymmdd.pos+eop.v50.snx.
References
- Bianco, G., Devoti, R., Luceri, V., 2003, Combination of loosely constrained solutions, Proceedings of the IERS Workshop on Combination Research and Global Geophysical Fluids (Munich, 18-21 Nov 2002), IERS Technical Note 30, 107-109, 2003.
- Bianco, G., Luceri, V., Sciarretta, C., 2006, The ILRS Standard Products: a quality assessment, to be submitted in the Proceedings of the 15th International Workshop on Laser Ranging (Canberra, 15-20 Oct 2006).
- Brockmann, E. (1996), Combination of Solutions for Geodetic and Geodynamic Applications of the Global Positioning System (GPS), Ph.D. Thesis, Astronomical Institute, University of Berne.
- Davies, P., Blewitt, G., 2000, "Methodology for global geodetic time series estimation: A new tool for geodynamics", JGR, vol. 105, no. B5.
- Kelm, R., 2007, Rigorous Variance Component Estimation in weekly Intra-Technique and Inter-Technique Combination for Global Terrestrial Reference Frames, submitted to Proceedings of the International IAG/FIG Symposium 'Geodetic Reference Frames GRF2006', Munich, 2007.
- Koch, K.R., 1999, Parameter Estimation and Hypothesis Testing in Linear Models, Springer-Verlag, Berlin.
Appendix 1
The list of biases to be considered in the routine analysis has been agreed within the AWG and it is the following:
- 1864 weekly range biases estimated from 1993.0 onwards
- 1868 weekly range biases estimated from 1993.0 onwards
- 1884 weekly range biases estimated from 1993.0 onwards
- 7210 weekly range biases estimated from 1993.0 to 2004.0
- 7237 weekly range biases estimated from 1993.0 onwards
- 7810 weekly range biases estimated for infrared data only
- 7811 weekly range biases estimated from 1993.0 to 1994.0
- 7835 weekly range biases estimated from 1993.0 to 1998.0
- 7839 weekly range biases estimated from 1993.0 to 1996 September 30
- 8834 weekly range biases estimated from 1993.0 to 1997.0
- 7840 weekly range biases estimated from 1993 January 1 to 1994 September 30;
- 18.5 mm added to one-way range from 1994 October 1 to 2002 January 31;
- 8.5 mm added to one- way range from 2002 February 1 onwards
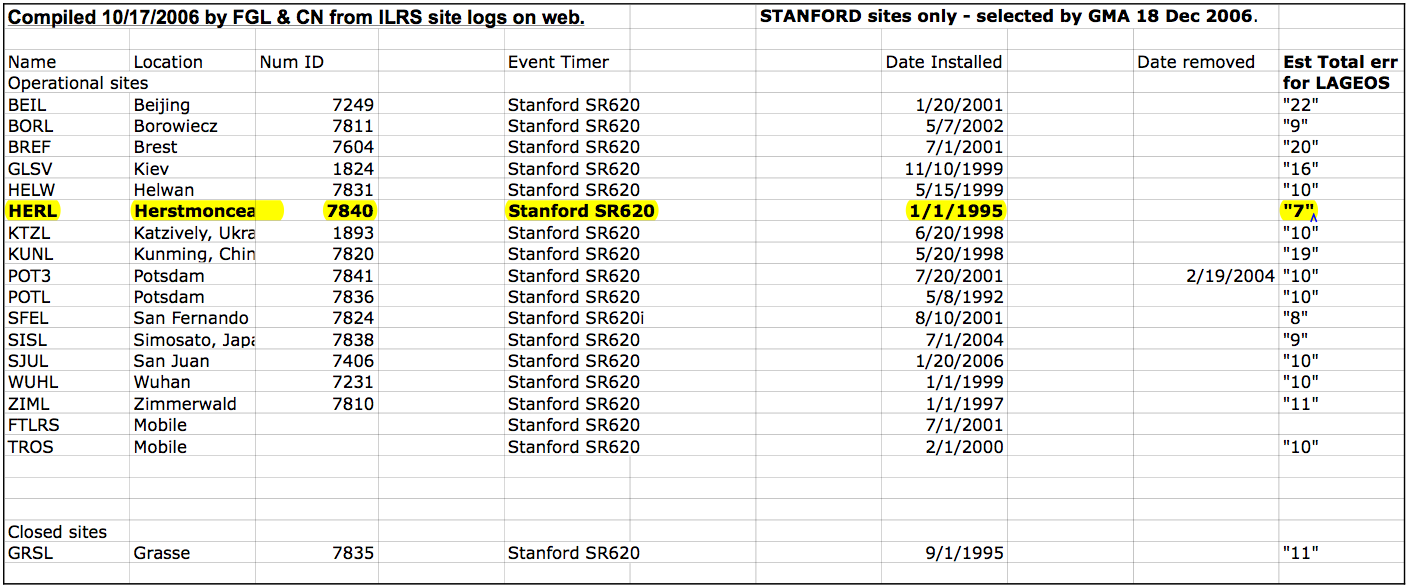
- Range bias due to Stanford event timer non-linearities as distributed by NSGF (errors to be added to one-way range), see Table 9 below. For 7840 the above mentioned treatment should be applied.
Table 9 - Biases of one-way ranges in mm due to Stanford event timer non-linearities as estimated at NSGF. The corrections listed in the last column are applicable to all satellites tracked by these sites during the period indicated.


